UNIT 3: Candlestick Anatomy
Candlestick Anatomy
A candlestick shows how price moved during a specific time period, such as 1 minute, 15 minutes, 1 hour, or 1 day.
Each candlestick has four main prices:
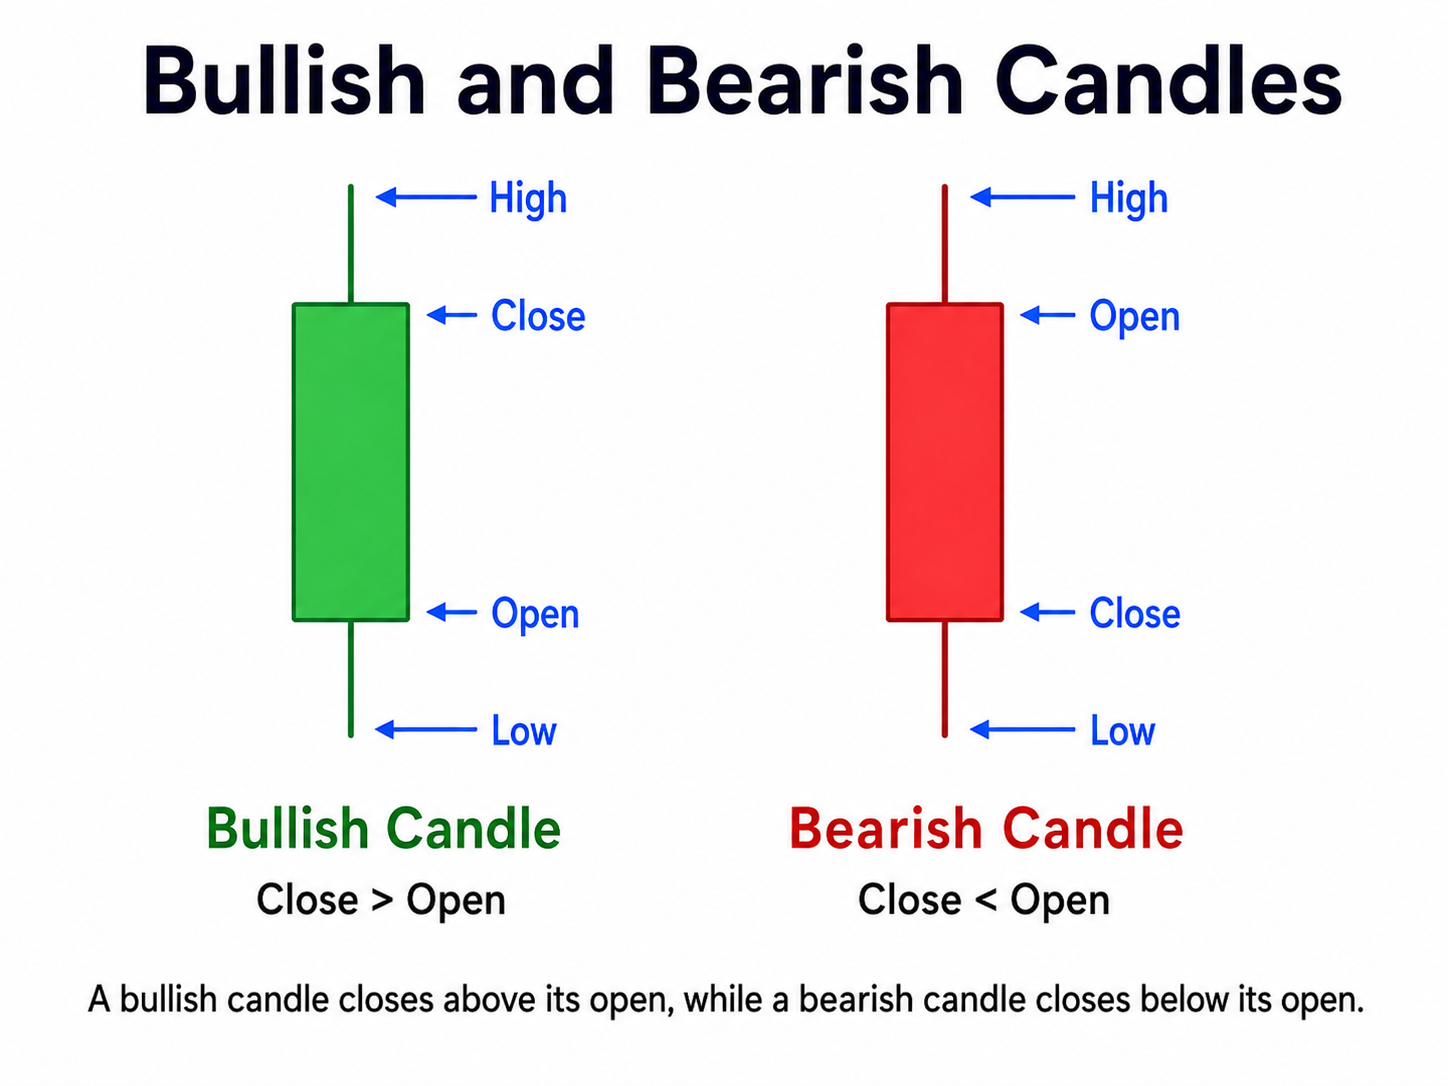
Open
The price where the candle started.
High
The highest price reached during that candle.
Low
The lowest price reached during that candle.
Close
The price where the candle ended.
Candle Body
The body is the thick part of the candle. It shows the distance between the open price and the close price.
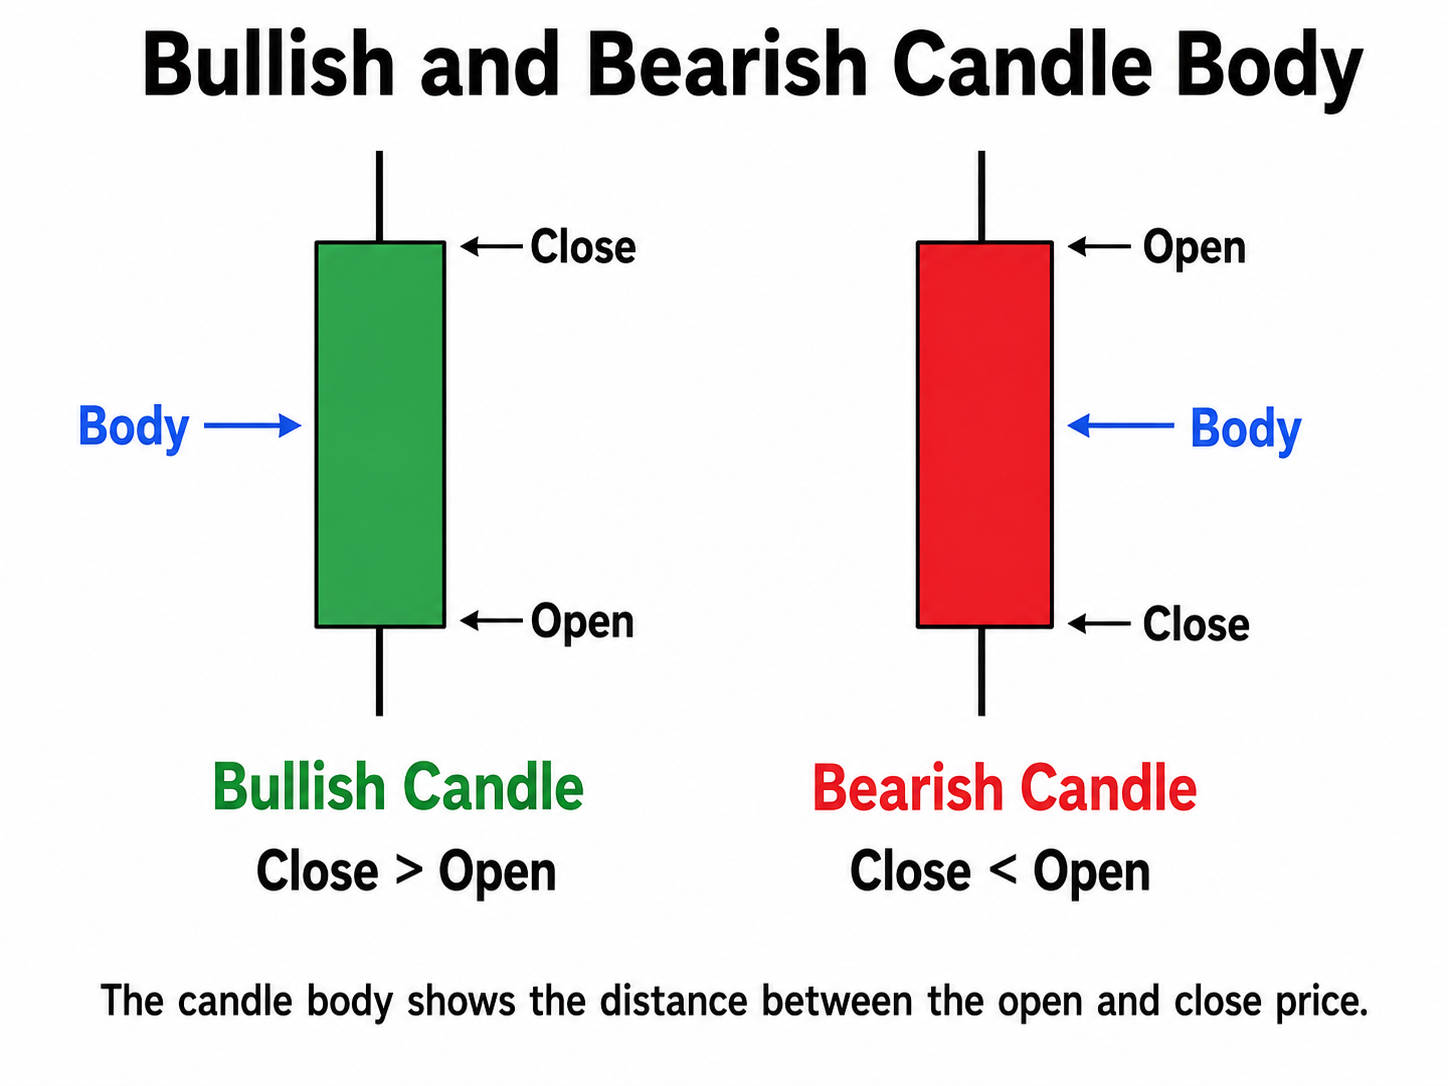
A large body means price moved strongly during that period.
A small body means price moved very little during that period.
Wick
The wick is the thin line above or below the candle body.
The upper wick shows the highest price reached before the candle closed.
The lower wick shows the lowest price reached before the candle closed.
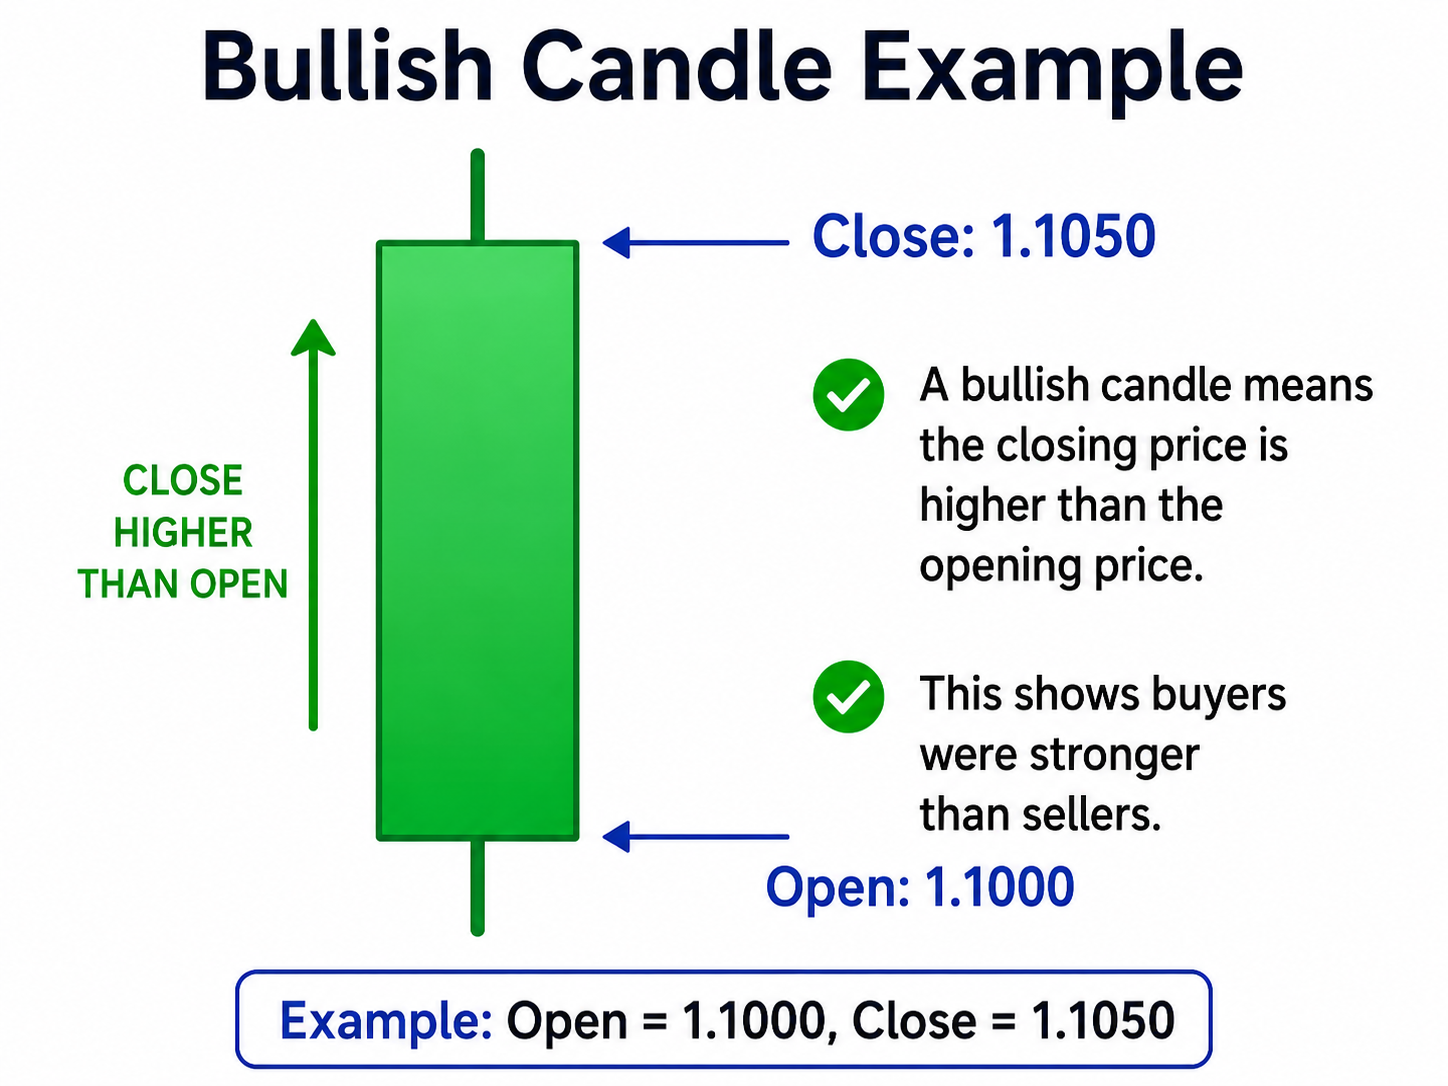
Bullish Candle
A bullish candle means the closing price is higher than the opening price.
This indicates that buyers were stronger than sellers during that period.
Example:
If price opened at 1.1000 and closed at 1.1050, the candle is bullish.
Bearish Candle
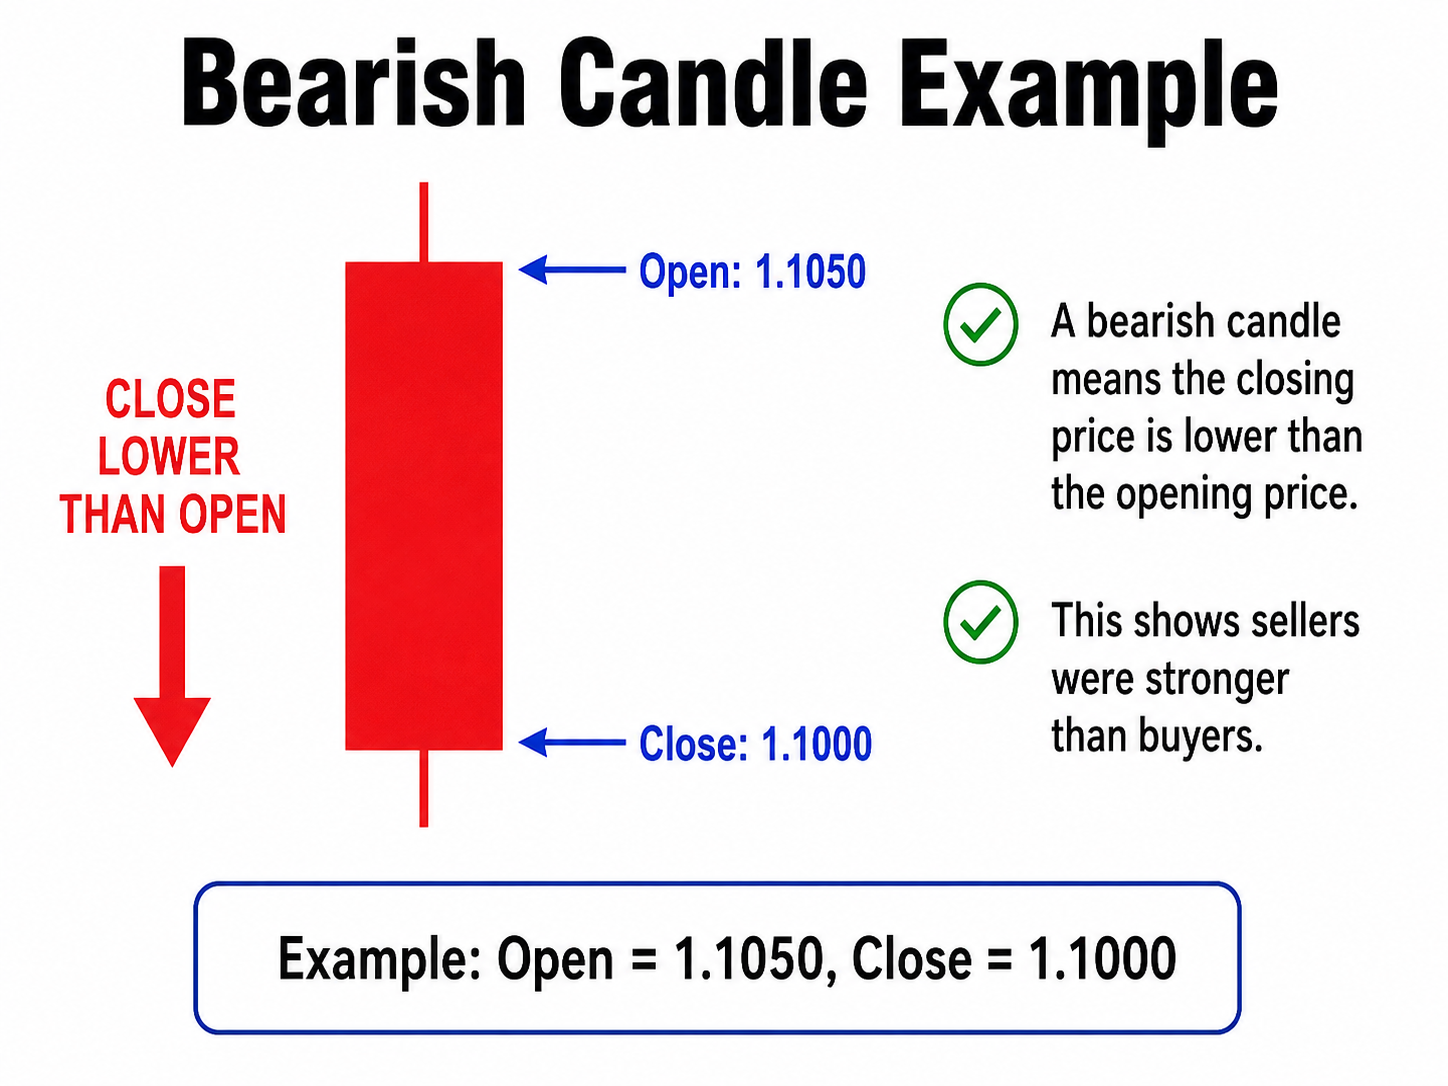
A bearish candle means the closing price is lower than the opening price.
This indicates that sellers were stronger than buyers during that period.
Example:
If price opened at 1.1050 and closed at 1.1000, the candle is bearish.
Summary
A candlestick shows the open, high, low, and close price for a specific period. The body shows the main price movement, while the wick shows how far price moved before the candle closed.
What Candlesticks Tell You
Candlesticks help traders understand what happened in the market during a specific time period.
Momentum
A large candle body shows strong momentum.
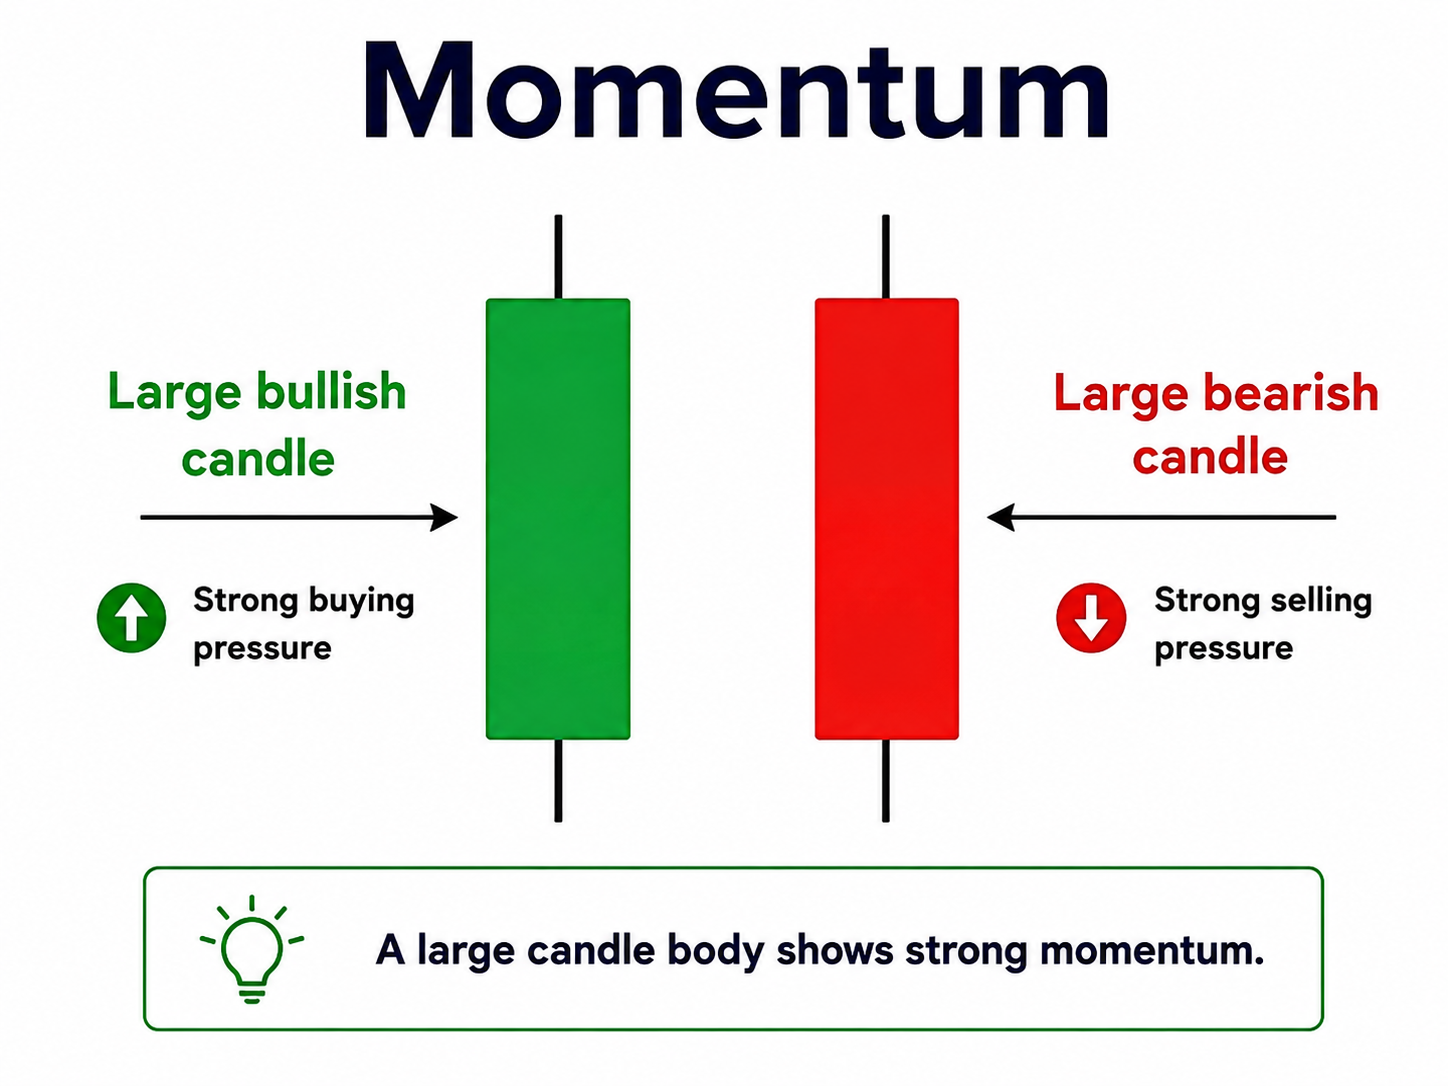
A large bullish candle shows strong buying pressure.
A large bearish candle shows strong selling pressure.
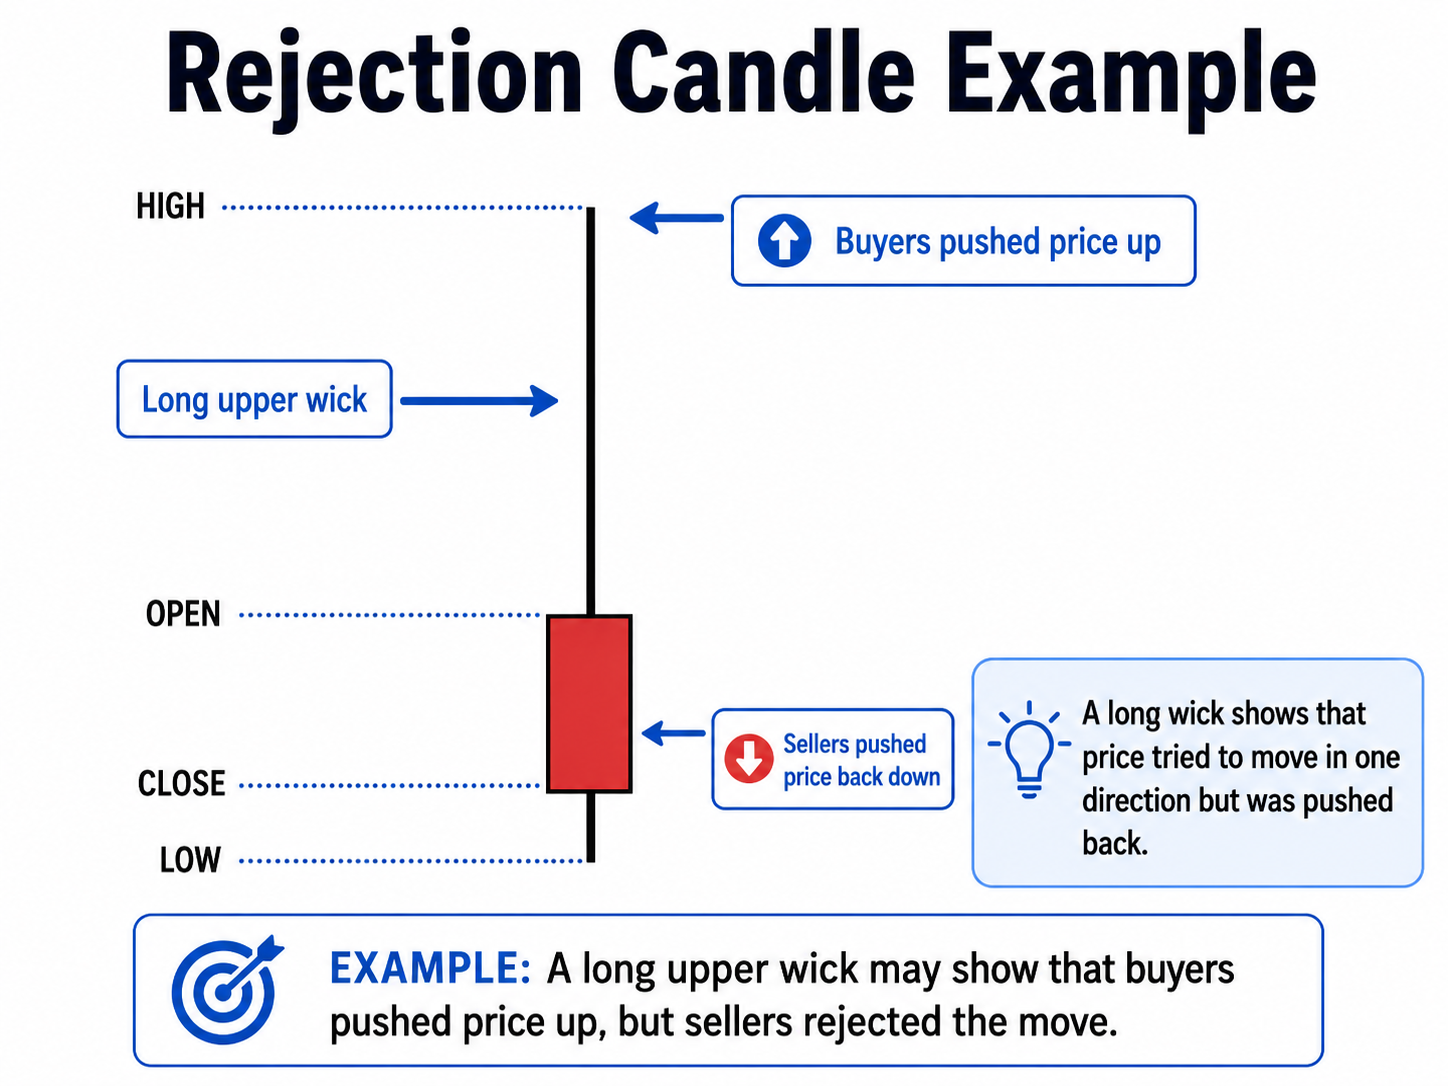
Rejection
A long wick shows that price tried to move in one direction but was pushed back.
Example:
A long upper wick may show that buyers pushed price up, but sellers rejected the move.
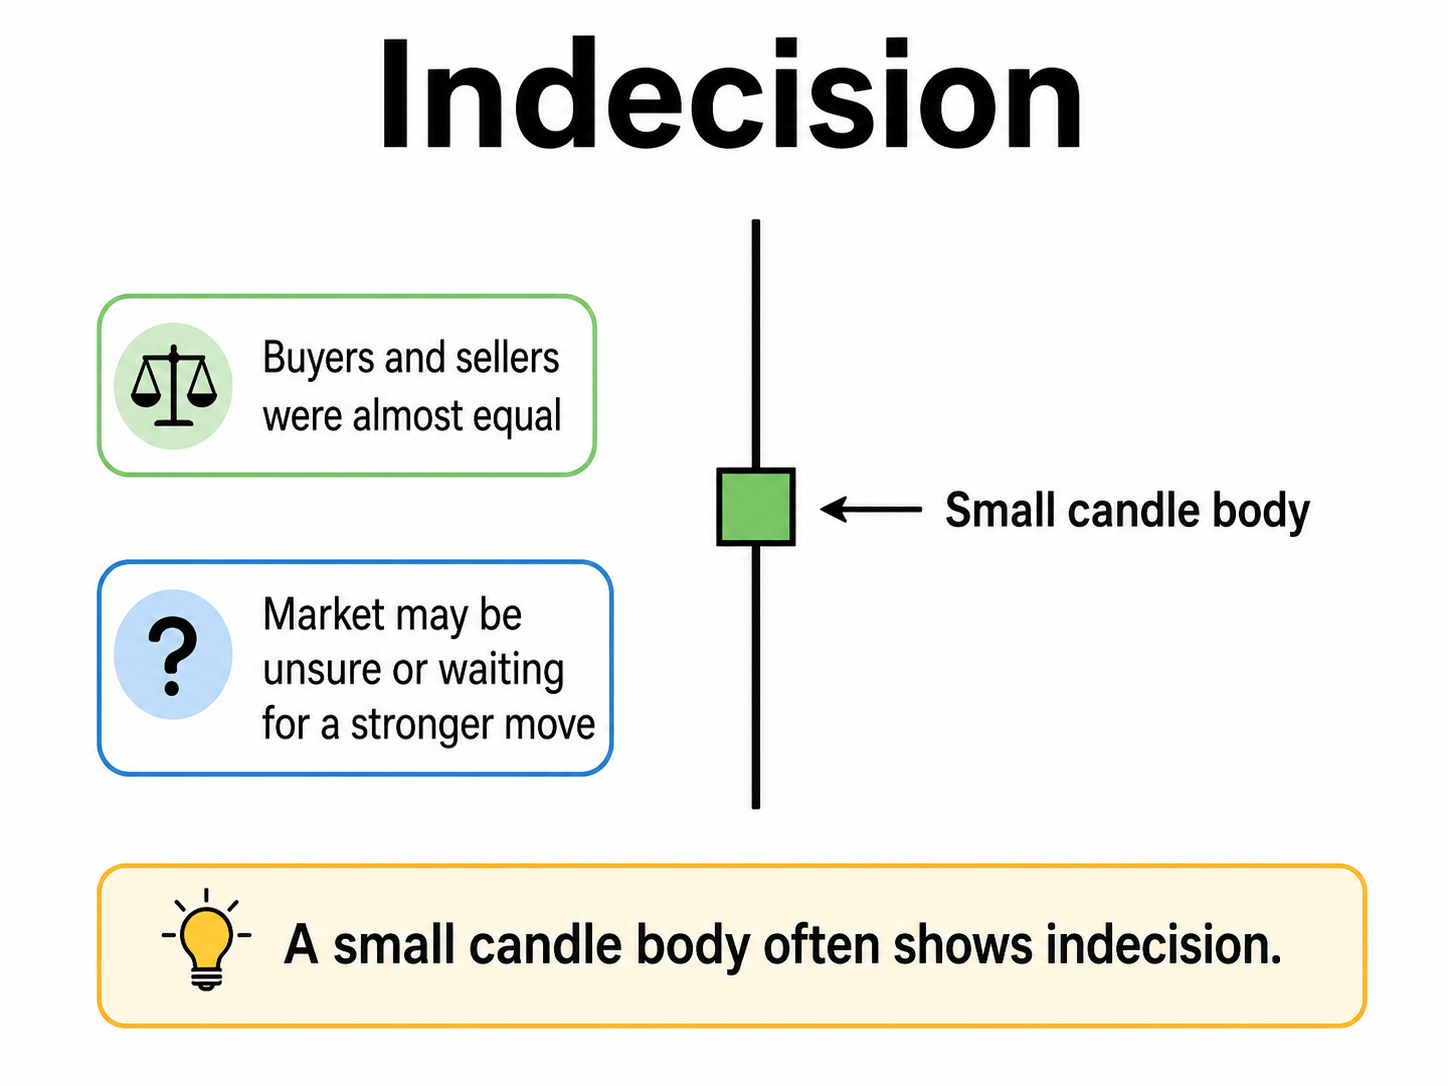
Indecision
A small candle body shows that buyers and sellers were almost equal.
This means the market may be unsure or waiting for a stronger move.
Buying and Selling Pressure
Candlesticks show whether buyers or sellers were stronger during that period.
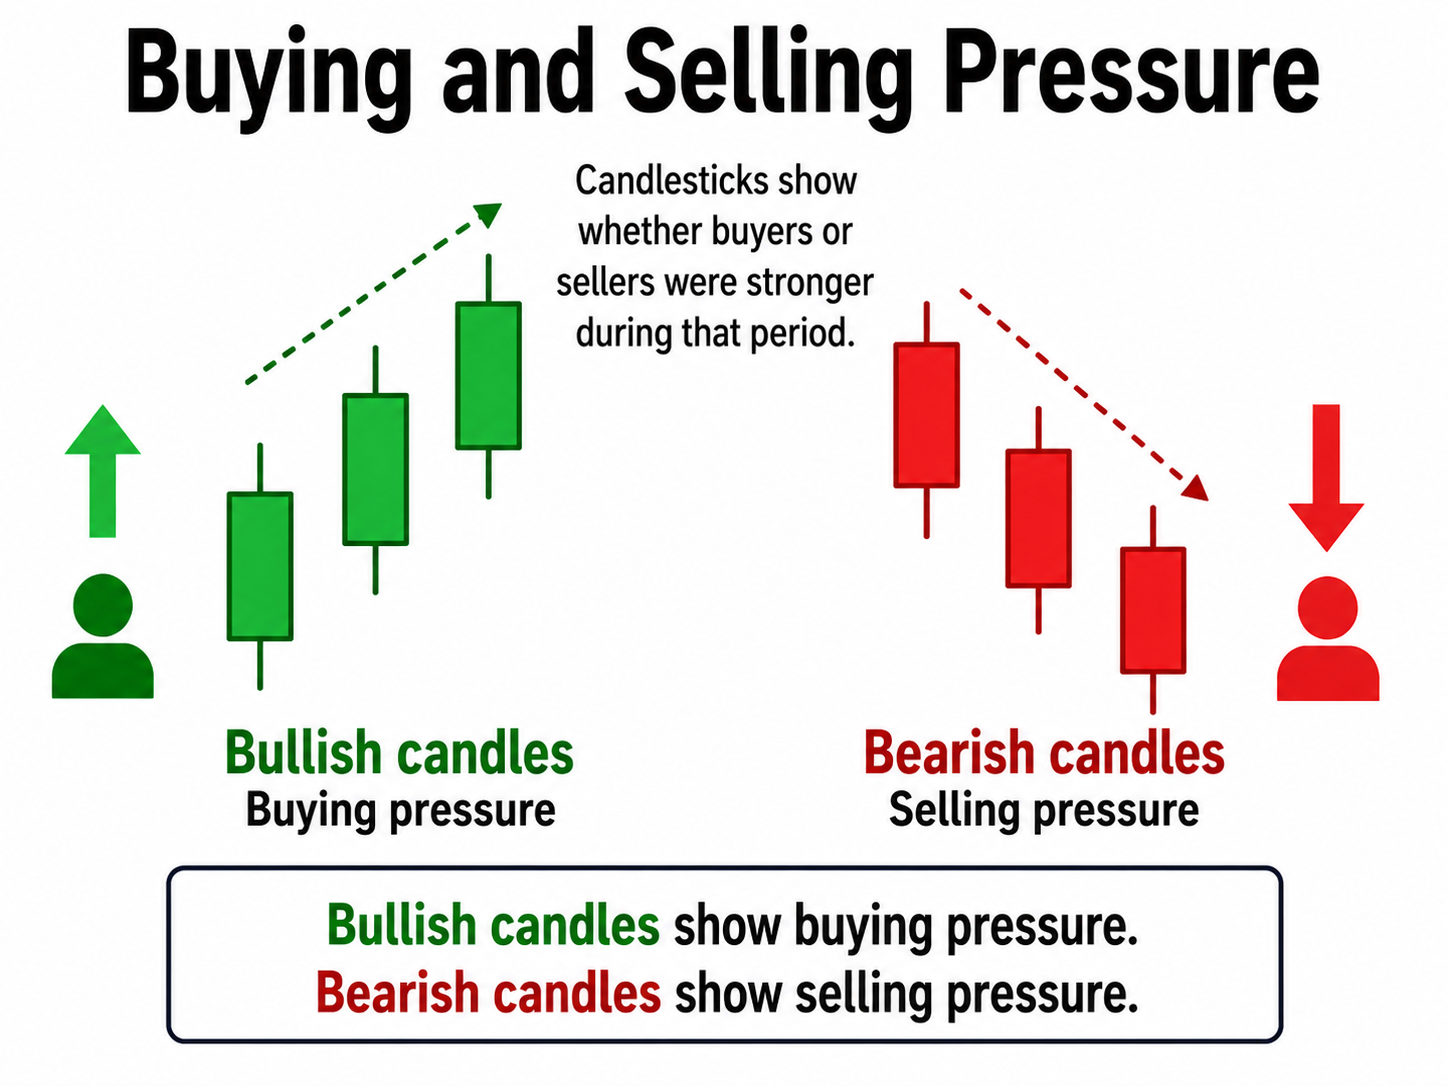
Bullish candles show buying pressure.
Bearish candles show selling pressure.
Candle Context
A candle should not be judged alone. Traders should look at where the candle forms.
Example:
A rejection candle at support may be more important than the same candle in the middle of the chart.
Summary
Candlesticks show market strength, weakness, rejection, and indecision. However, they are most useful when analyzed together with the overall market context.
Basic Candlestick Patterns
Candlestick patterns help traders understand possible market direction. They should not be used alone, but together with support, resistance, trend, and market context.
Doji
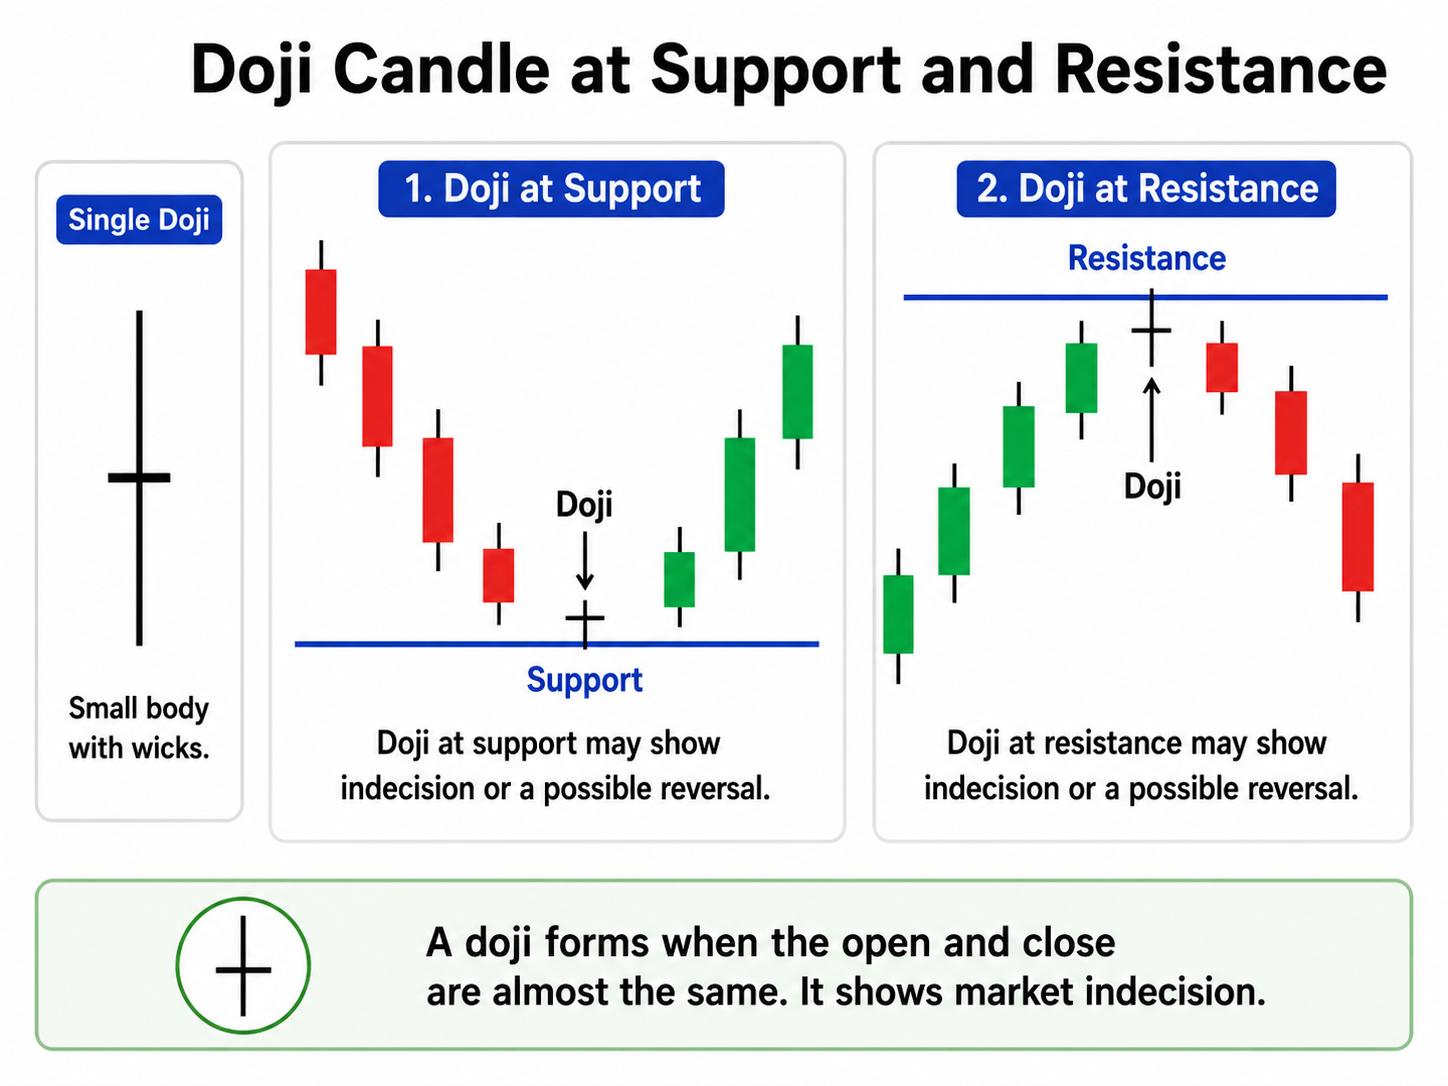
A doji forms when the open and close prices are almost the same. It has a very small body and large wicks.
It shows indecision because buyers and sellers were almost equal.
A doji appearing at a level of support or resistance shows a possible price reversal. Example: A doji appearing at a level of resistance could indicate a possible price reversal from uptrend to downtrend
(More on support and resistance, and trends will be discussed in unit 4 of this course)
Engulfing Pattern
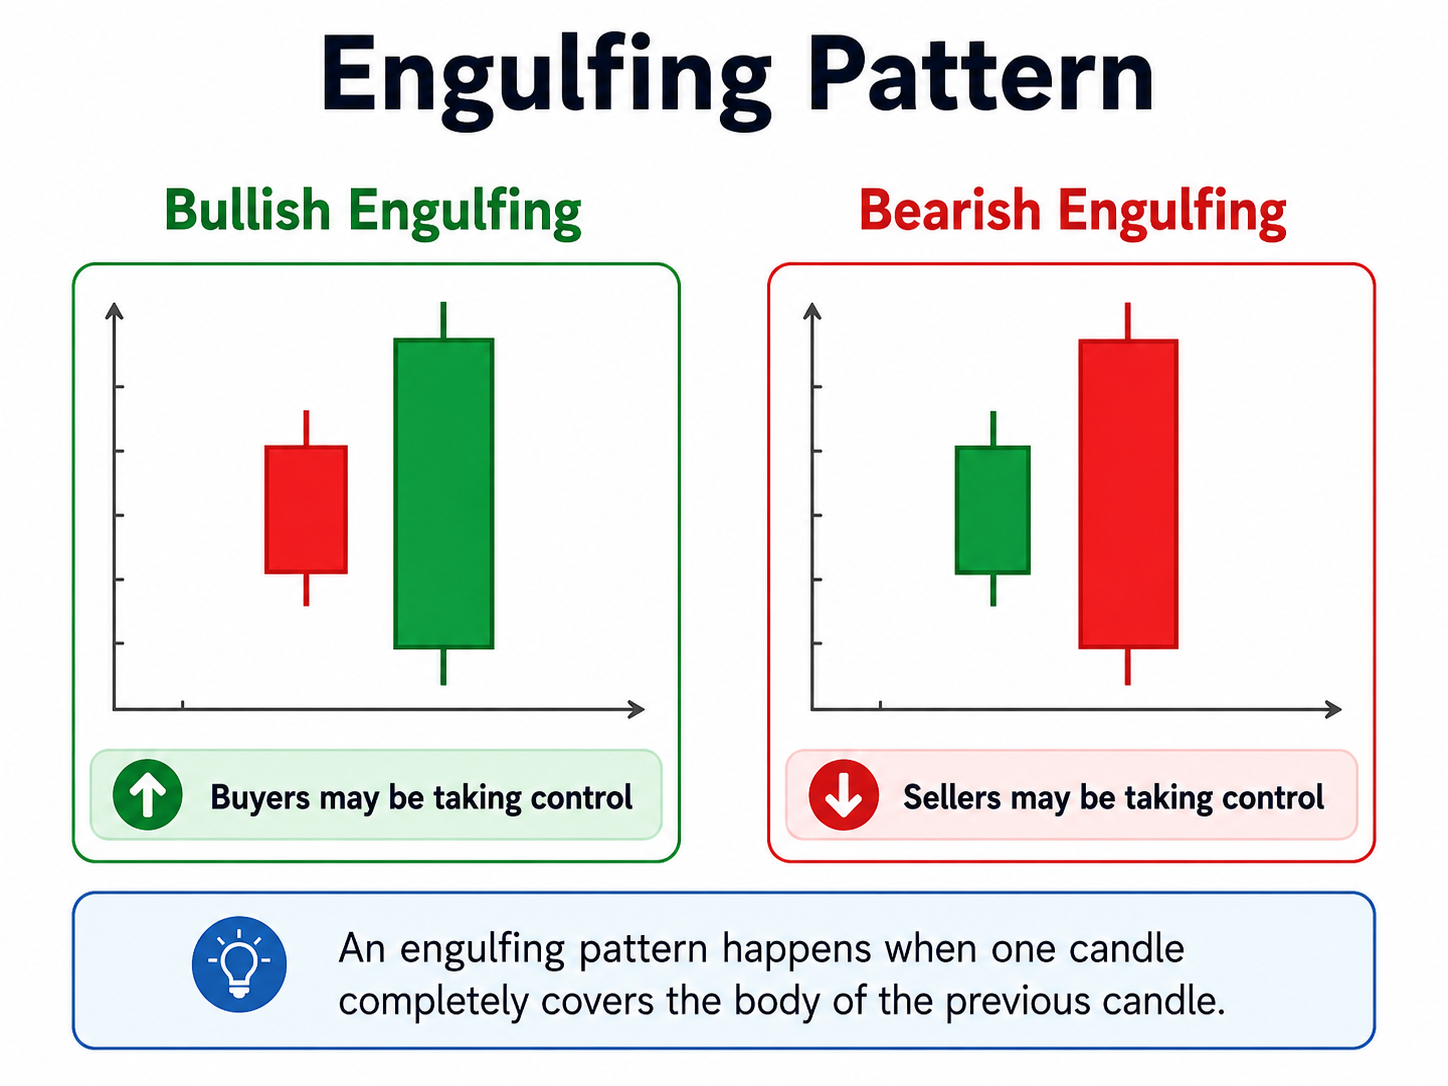
An engulfing pattern happens when one candle completely covers the body of the previous candle.
A bullish engulfing may show buyers are taking control.
A bearish engulfing may show sellers are taking control.
Pin Bar
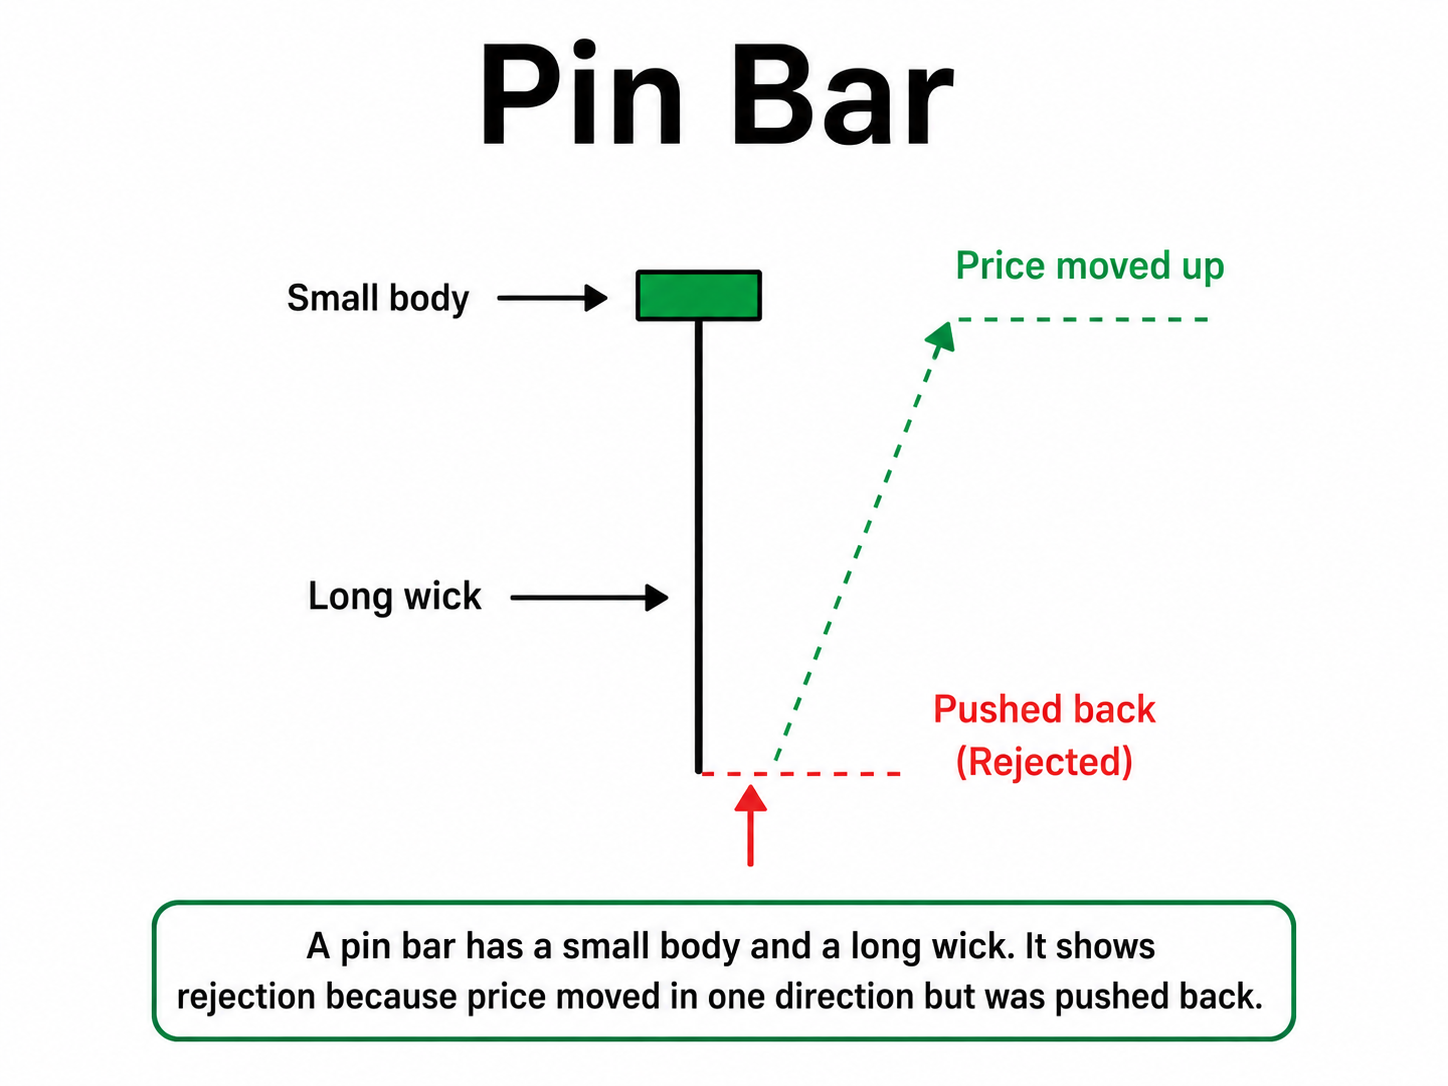
A pin bar has a small body and a long wick.
It shows rejection because price moved in one direction but was pushed back.
Hammer
A hammer has a small body and a long lower wick.
It often appears after a downward move and may show that buyers are starting to reject lower prices.
Shooting Star
A shooting star has a small body and a long upper wick.
It often appears after an upward move and may show that sellers are rejecting higher prices.
Morning Star
A morning star is a bullish reversal pattern.
It usually appears after a downtrend and may show that sellers are losing control while buyers are becoming stronger.
Evening Star
An evening star is a bearish reversal pattern.
It usually appears after an uptrend and may show that buyers are losing control while sellers are becoming stronger.
Summary
Candlestick patterns help traders read market behavior. They show signs of momentum, rejection, indecision, and possible reversals, but they work best when confirmed by the overall market context.